

Smart Health Navigator – AI-Assisted Triage and Integrated Scheduling Platform
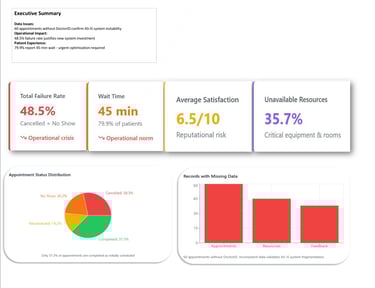
The healthcare industry faces mounting pressure to enhance operational efficiency without compromising quality of care. The hospital was suffering from a critical operational inefficiency driven by fragmented legacy systems and manual processes. The Business Pain (Validated by EDA): The current AS-IS system resulted in 79.9% of patients experiencing a 45-minute average wait time (validated by the feedback_data), and an appointment instability rate (Cancelled + No Show) of 48.5% (appointment_data). This instability directly led to lost clinical capacity and damaged the hospital's reputation (low NSAT score).
8/26/20255 min read
I served as the crucial link between the business need (reducing the 45-minute wait time) and the technical solution. This included performing the Exploratory Data Analysis (EDA) to quantify the inefficiency (48.5% instability rate), defining the Success KPIs (KPI-5: Wait time reduction), and creating the Functional Model (BRD, Use Cases) for the AI Module and Mobile App.
Also I led the definition of the Work Breakdown Structure (WBS) and the Risk Management Plan (R01, R02). My primary focus was mitigating the High Severity Integration Risk (R02), ensuring business continuity with the legacy billing system through a robust API strategy.
Role
Background
The healthcare industry is facing increasing pressure to improve operational efficiency without sacrificing quality of care. At the Hospital, this pressure manifested as critical operational inefficiency driven by legacy systems, manual processes, and a lack of real-time data visibility.
The Consequence of Inefficiency:
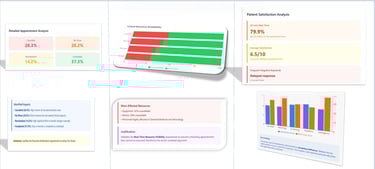
Deteriorated Patient Experience (PX): Our Exploratory Data Analysis (EDA) revealed that 79.9% of patients reported an Average Wait Time of 45 minutes, the main cause of dissatisfaction and a clear indicator of the performance gap.
Loss of Capacity and Resources: The AS-IS process resulted in an Appointment Instability Rate of 48.5% (Cancellations + No Shows), which directly translates to lost revenue and underutilization of valuable clinical resources.
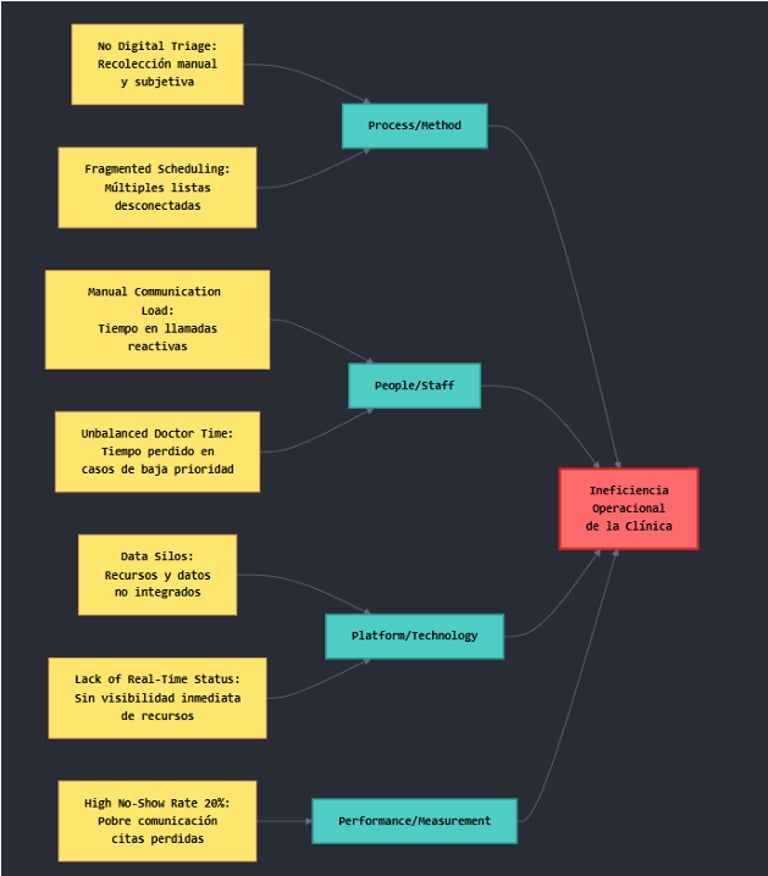
The Root Cause (Validated by Analysis)
The current process was unsustainable. The Root Cause Analysis (Ishikawa Diagram) identified four pillars of failure:
Process/Method: Reliance on Fragmented Scheduling (multiple disconnected lists) and No Digital Triage (subjective classification), which prevented optimal scheduling.
Platform/Technology: Data Silos and the Lack of Real-Time Resource Status (validated by the high rate of 'Under Maintenance' or 'Unavailable' equipment/rooms in the resource_data.
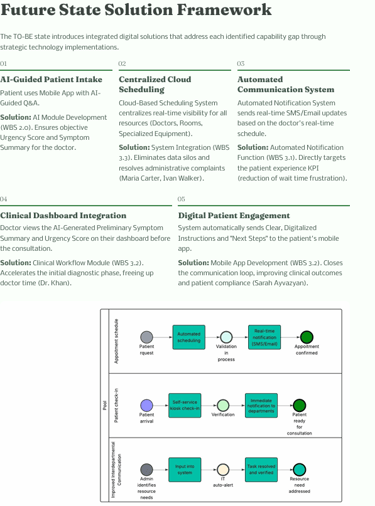
The Business Need: It was imperative to transform the manual AS-IS processes into a digital, integrated, and AI-assisted TO-BE solution to stabilize operations and restore patient confidence.
Project objectives
The Smart Health Navigator project was not merely intended to implement new technology, but to achieve a quantifiable shift in the hospital’s operational and patient experience metrics. The objectives were defined as SMART goals, directly addressing the critical failures identified in the EDA and Root Cause Analysis.
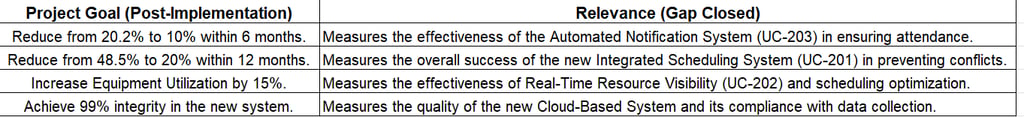
Operational Stabilization: Appointment No Show Rate (KPI-1): Reduce revenue and capacity loss due to missed appointments.
Patient Experience Excellence: Average Wait Time (KPI-5): Address the primary source of patient dissatisfaction (79.9% of feedback).
Clinical Quality & Efficiency: AI Urgency Accuracy Rate (KPI-8): Ensure physician trust and efficient case prioritization (Mitigation R01).
Resource Optimization: Critical Resource Utilization (KPI-3): Eliminate scheduling conflicts and wasted capacity.
By focusing on these defined metrics, the project aims to recapture lost capacity equivalent to 10.2% of scheduled appointments and significantly elevate the Net Satisfaction Score (NSAT) from its current baseline of $6.5$. These objectives form the basis for the final Cost-Benefit Analysis (CBA) and ROI calculation.


Approach
As Project Manager and Business Analyst, I employed a Hybrid Methodology—combining the flexibility of Agile for core development with the disciplined planning of PMBOK—to successfully manage technical complexity (AI and Integration) and stakeholder expectations.
The initial phase was driven by detailed analysis to translate high-level business pain into actionable, measurable requirements:
Diagnosis: Utilized Exploratory Data Analysis (EDA) and Root Cause Analysis (Ishikawa) to generate the quantitative baseline and justify the entire project investment.
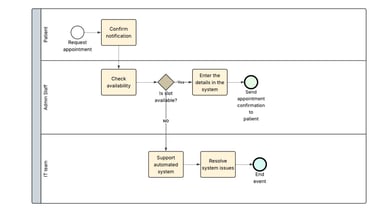
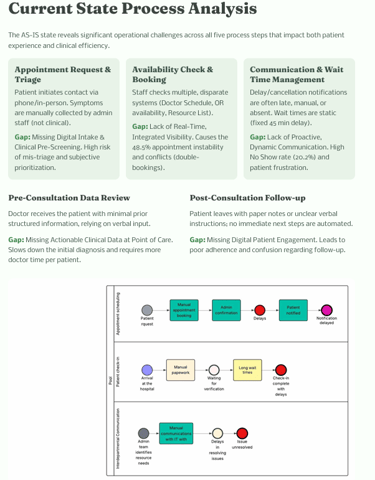
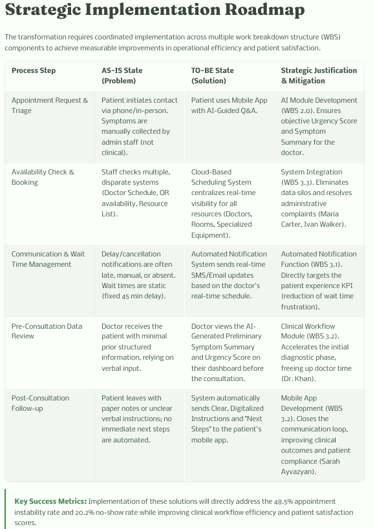
Process Definition: Executed a comprehensive Gap Analysis to map the inefficient AS-IS process flow to the optimized TO-BE process flow. This difference formed the core of the required change.
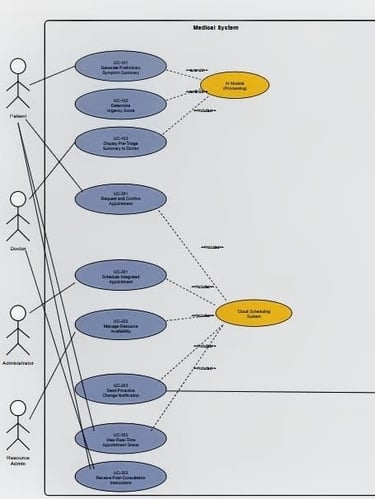
Requirements Elicitation: Conducted structured interviews to define the Business Requirements Document (BRD) and validate functional requirements through detailed Use Cases (e.g., UC-201: Integrated Scheduling), ensuring the solution directly solved the administrative and clinical pain points.
Deliverable Integration: The Gap Analysis, AS-IS and TO-BE Process Flows, and the BRD serve as concrete evidence of the Business Analysis rigor.
Project Management Strategy
My strategic focus was on mitigating high-severity risks and ensuring clear project execution through structured deliverables:
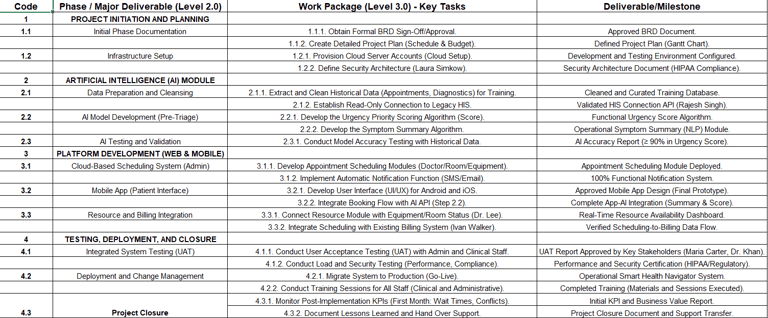
Work Breakdown Structure (WBS): The project was segmented into four distinct phases (Discovery, Development, Integration, Deployment) to manage scope and monitor progress using clear milestones.
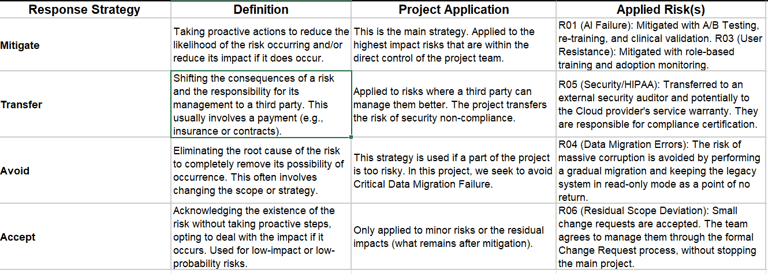
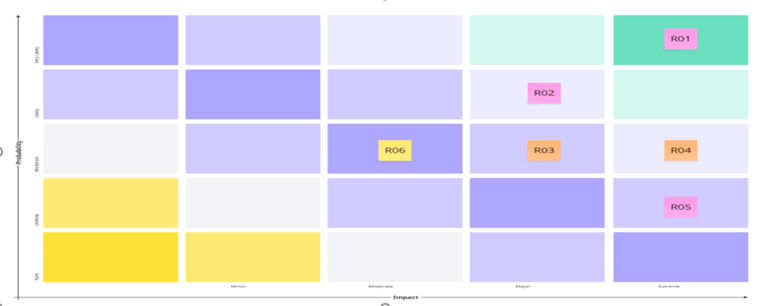
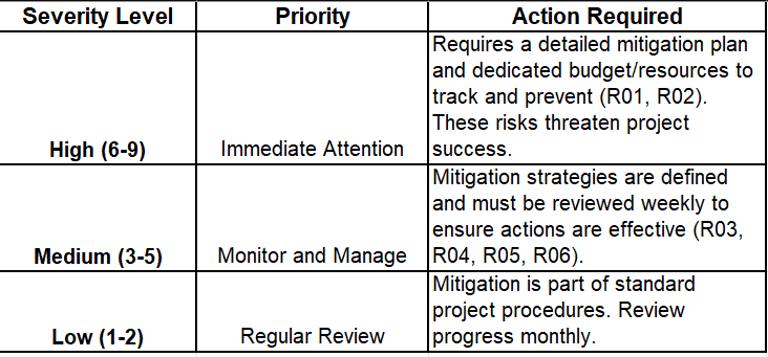
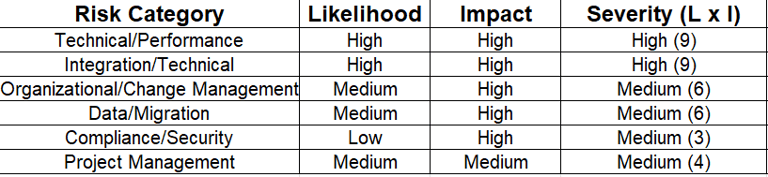
Risk Prioritization: I led the development of the Risk Management Plan, prioritizing the two critical threats (R01: AI Accuracy and R02: Legacy Integration) and formally defining the Mitigate, Avoid, Accept, Transfer strategies to proactively protect the project timeline and budget.
Change Management: Given the high risk of User Resistance (R03), I integrated the Change Management Plan into the WBS, ensuring dedicated resources for Role-Based Training and stakeholder buy-in before the Go-Live.
Tools
The selection of tools was critical to ensure the accuracy of the analysis, the traceability of requirements, and transparency in risk management throughout the project lifecycle.
MS Excel / Python (simulated): Data Analysis (EDA: 45 min. wait time; 48.5% instability); KPI Baseline.
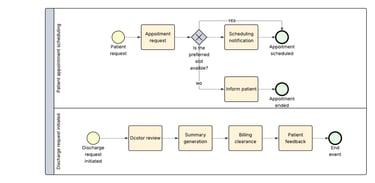
BPMN (simulated) / Visio: Swimlane Diagram and Workflow Process (AS-IS and TO-BE), Use Cases.
Excel: Work Breakdown Structure (WBS), Risk Matrix, and Definitive Mitigation Plan.
Word / Excel: Business Requirements Document (BRD) and Requirements Traceability Matrix (RTM) (simulated).
Power BI: KPI Dashboard (Projected)
Actions/Implementation
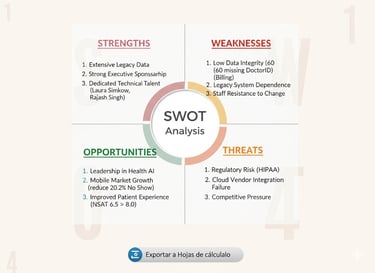
Project implementation required strategic decisions that prioritized operational stability and user adoption, especially given the criticality of integration with legacy systems (R02) and clinical trust in the new AI (R01). These decisions were grounded in the impact analysis from the use cases and the framework of the SWOT Analysis.
Robust API Strategy vs. Full Migration: Risk R02 (Legacy Integration Failure). Based on the WBS and the BRD (Integration Requirement).
Data Cleansing Prioritization: Risk R04 (Critical Migration Errors). Based on the EDA and the validation of the AS-IS Process.
A/B Testing Implementation with Feedback Loop: Risk R01 (AI Accuracy Failure). Based on the Definitive Mitigation Plan and Clinical Use Cases.
Train the Trainer" Focus and Usage Monitoring: Risk R03 (High User Resistance). Based on the Change Management Plan and SWOT Analysis (Weakness W3).
My role was to ensure that every project phase was tied to a proactive defense against instability. By prioritizing the isolation of the legacy system and securing confidence in the AI through clinical feedback, we were able to focus on functionality rather than correcting critical post-deployment errors.
Results/Impact
The Smart Health Navigator project is justified by its ability to convert operational inefficiencies into tangible economic and clinical capacity gains. The projected results confirm a high return on investment (ROI) within the executive planning horizon.
Avg. Wait Time (KPI-5): 45 minutes (79.9% patient report)
No Show Rate (KPI-1): 20.2% (appointment_data)
Appointment Instability: 48.5% (Total Cancellations + No Shows + Rescheduled)
AI Accuracy (KPI-8): N/A (Manual Triage)
Target and strategic impact we achieved
+55.5% improvement in Patient Experience (PX) and a significant boost to the NSAT score.
Recaptures 10.2% of lost revenue and adds significant available clinical capacity.
Stabilizes the operational schedule, reducing staff load (R03) and resource waste (KPI-3).
Ensures clinical trust and efficient use of physician time by correctly prioritizing cases (KPI-9).

Lessons learned
The Smart Health Navigator project offered critical strategic and operational insights, confirming that successful transformation requires prioritizing data integrity and active change management alongside technical development.
Data Integrity & Risk R04: Data Quality is the #1 Risk: The low integrity of the legacy data (validated by the AS-IS Process and EDA) proved to be a higher initial hurdle than technical integration.
Change Management (R03): Change is Managed, Not Imposed: The high severity of User Resistance (R03) confirmed that the Change Management Plan was as crucial as the technical build.
Methodology: Rigidity vs. Flexibility: The Hybrid Methodology (Agile/PMBOK) was the most effective approach. Agile provided flexibility for AI development, while PMBOK enforced the necessary discipline for critical Risk Management (R01, R02) and legacy Integration.
SWOT Validation: Protecting Strengths: The SWOT Analysis confirmed that transferring the HIPAA Risk (R05) allowed us to use the Strength (S3: Dedicated Technical Talent) to focus on the core AI/Scheduling goals, not regulatory certification.
This proposal represents more than just an IT solution; it is a roadmap for operational efficiency and a strategic move to reposition the hospital's brand in the highly competitive healthcare market. By achieving the projected 45-minute wait time reduction and securing the 10.2% revenue recovery (KPI-1), the Smart Health Navigator will redefine the patient experience and generate a sustainable competitive advantage.
Connect
© 2025. All rights reserved.