

Case Study: EcoGrow X-Series – IoT Vertical Aquaponics Platform for Resource Efficiency Optimization
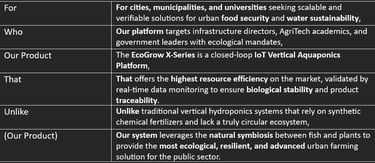
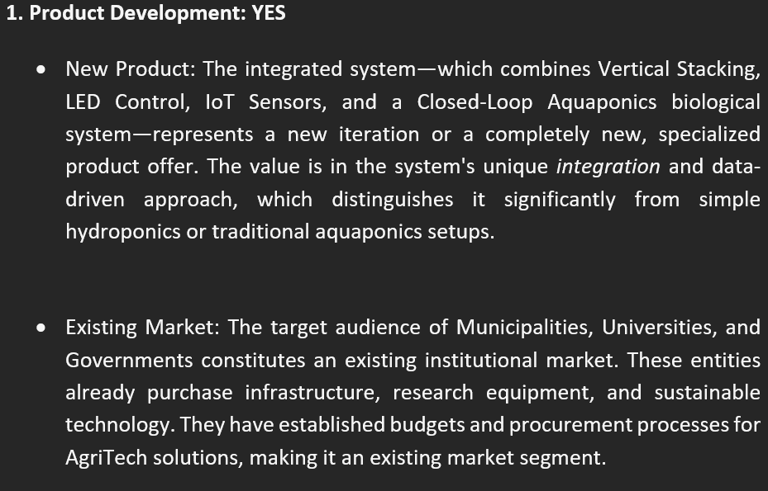
The EcoGrow X-Series is an institutional-grade Internet of Things (IoT) platform and vertical farming solution designed for Municipal Governments and Agricultural Research Universities. The core value proposition is the verifiable optimization of ecological resources, quantified by the Resource Efficiency Score (RES), and the mitigation of the high biological risk ($R1$) inherent in controlled environment agriculture.The project involved the full Product Lifecycle Management (PLM), from initial Product Vision and Business Case justification (CapEx) through a rigorous Beta Plan validation and the development of a data-driven Demand Generation Plan tailored for the B2G sector. A key objective was to transition the product from a minimum viable product (MVP) to a scalable, institutionally-backed infrastructure solution.
10/24/20254 min read
As the Principal Product Manager/Business Analyst, my significance to the EcoGrow X-Series project was defined by the following strategic contributions:
Strategic and Financial Leadership
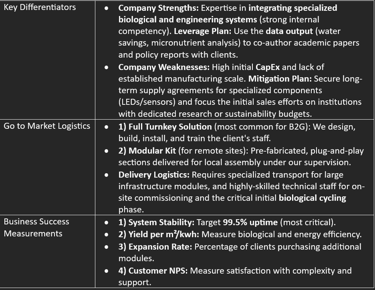
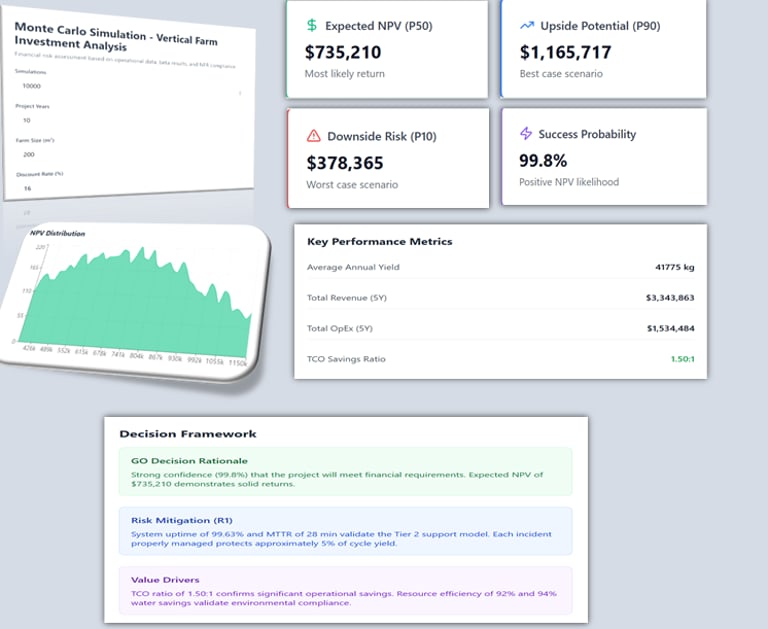
Financial Justification: Developed the comprehensive Business Case and the Outcome Summary Dashboard, utilizing a Monte Carlo Simulation to successfully quantify the financial risk (NPV distribution) associated with the project's high initial CapEx.
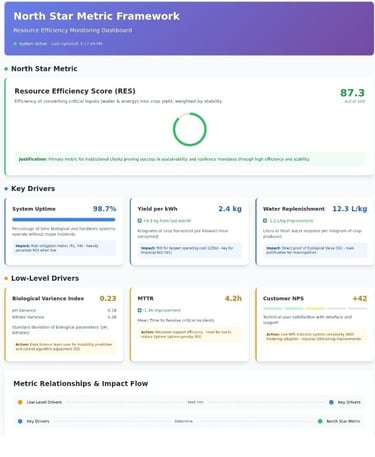
Value Quantification: Established the North Star Metric (RES ≥0.95) to align engineering efforts (NFRs like Uptime and MTTR) directly with institutional buyer value (Resource Efficiency and TCO Savings Ratio).
Risk Mitigation and Product Readiness
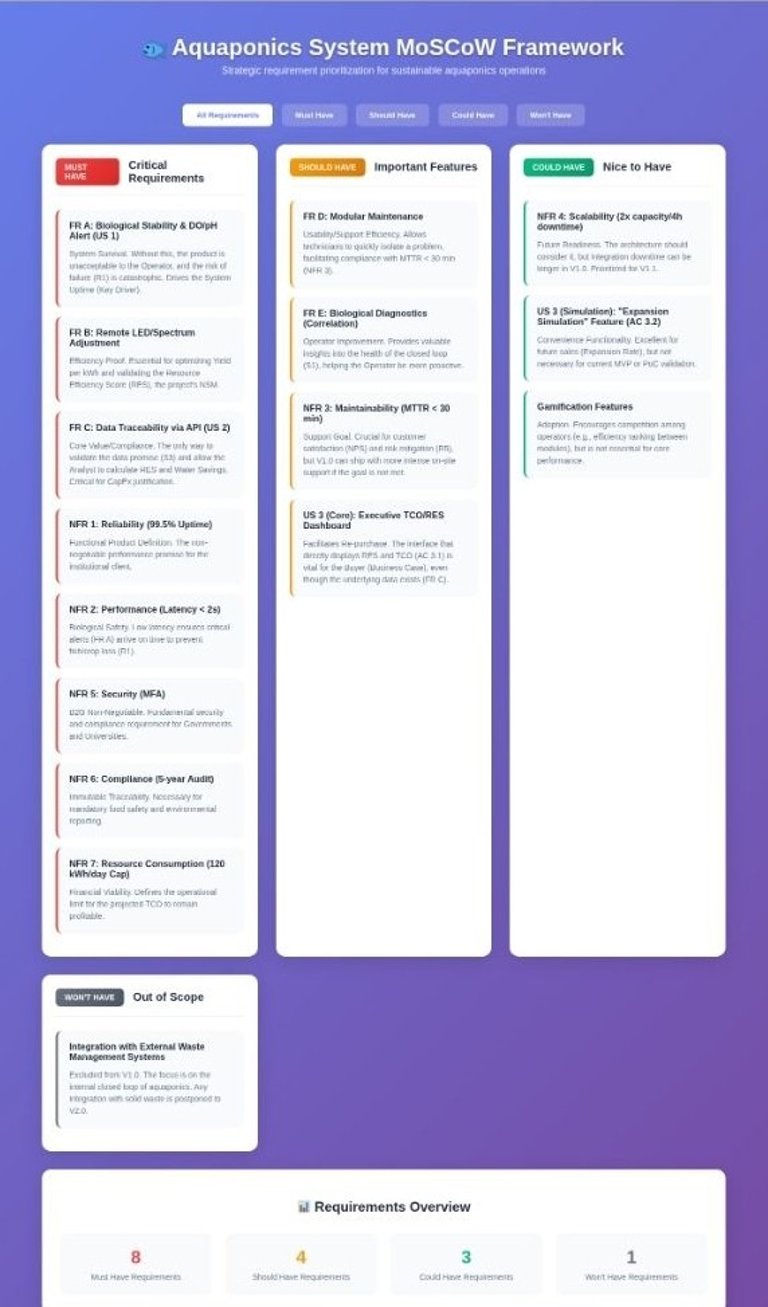
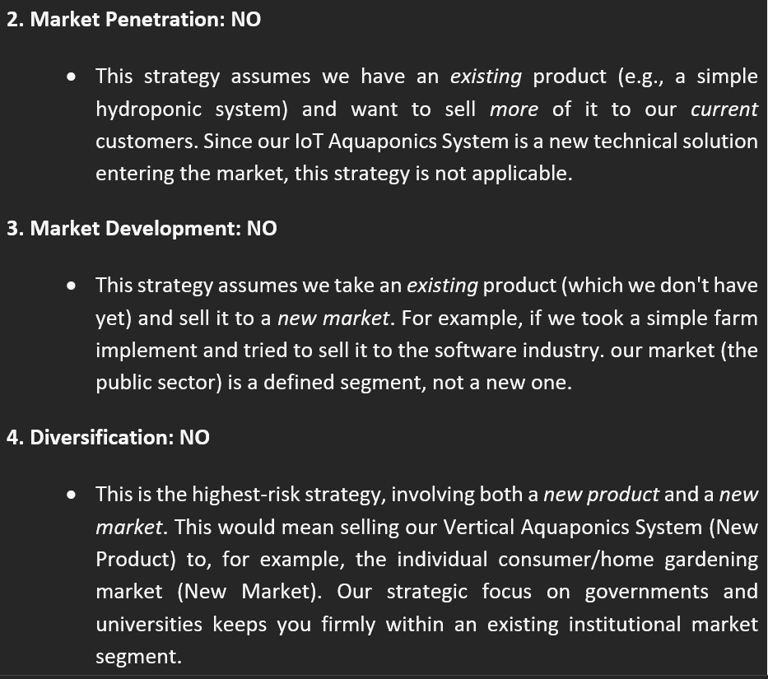
Risk Management: Led the identification and mitigation of the critical biological risk (R1) by prioritizing the MUST HAVE features (via MoSCoW) focused on low-latency alerts and remote override (NFR 1, NFR 3).
Go-To-Market (GTM) Ownership: Orchestrated the Launch Readiness Assessment and designed the Demand Generation Plan, focusing content strategy (PoV Reports) on converting Sales Qualified Leads (SQLs) into Proof of Concept (PoC) Proposals.
Full Product Lifecycle Management
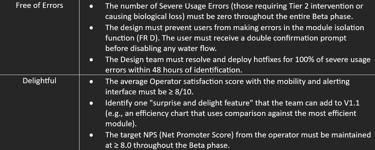
Product Definition: Managed the technical scope via the PRD and User Story documentation, ensuring alignment with the Beta Phase objectives.
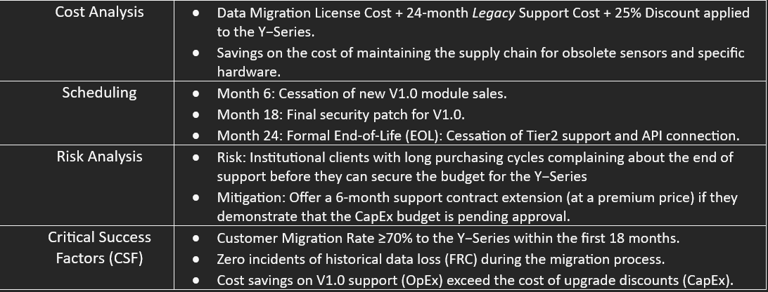
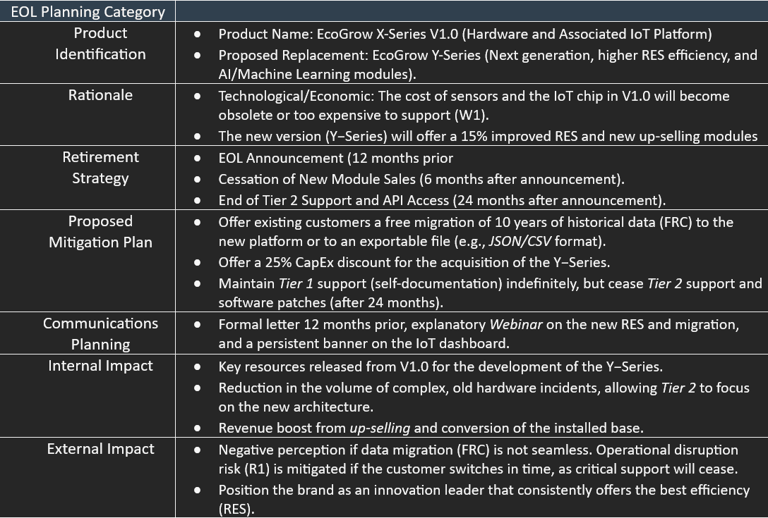
Sustainability Planning: Proactively developed the detailed End-of-Life (EOL) Plan, outlining mitigation strategies (data migration, upgrade discounts) and setting the Critical Success Factors (CSF) for the transition to the future Y-Series, thus securing long-term customer relationships and managing technical obsolescence.
In essence, my performance ensured the product transitioned from a technical concept into a financially viable, low-risk infrastructure investment, successfully validating the core value proposition for institutional adoption.
Role
Context
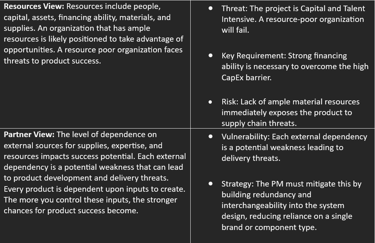
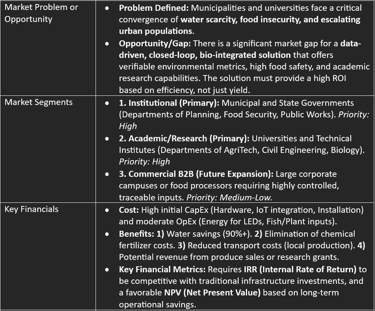
Central business problem
Controlled Environment Agriculture (Vertical Farming) faces a Capital Expenditure (CapEx) dilemma: the promise of water and energy efficiency is constantly threatened by the Biological Risk (R1) of catastrophic crop failure. The lack of real-time control and high operational complexity in existing systems limit mass adoption.
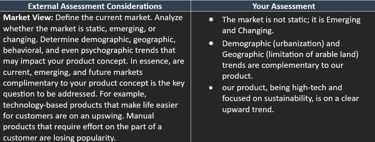
Industry status quo
Current competitors offer fragmented solutions (hardware-only or software-only) that fail to quantify or guarantee the Return on Investment (ROI) in a verifiable manner. The absence of a clear metric like the RES leaves institutional CFOs without solid arguments to meet their sustainability and efficiency mandates.
The B2G Sector Pain
The institutional client (Government/University) requires robust financial justification, which translates into the need for Operational Uptime ≥99.5% and the assurance that historical performance data (FR C) will be preserved for long-term audits.
Project Objectives
Strategic Objective
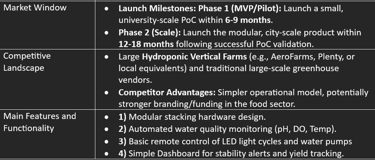
Establish a new standard for ecological infrastructure that validates Resource Efficiency (RES) in institutional environments and achieves an Expansion Rate (O2) of 50% of Beta customers into full-scale installations within the first 12 months.
Key Success Metrics
North Star Metric: Resource Efficiency Score (RES) ≥0.95. Ensure the architecture meets reliability requirements to mitigate risk: Operational Uptime ≥99.5% (NFR 1) and MTTR ≤30 minutes (NFR 3).
Financial Goal
Project a Positive NPV (Net Present Value) Probability ≥90% over 10 years, demonstrating that the TCO (Total Cost of Ownership) justifies the high initial CapEx investment.
Approach
Product Management
An Agile (Scrum) methodology was adopted for development, and the MoSCoW matrix was used for prioritization, ensuring Tier 2 Support was a critical MUST HAVE. The Launch Readiness Assessment was managed to validate support requirements before the Beta phase.
Business analyst
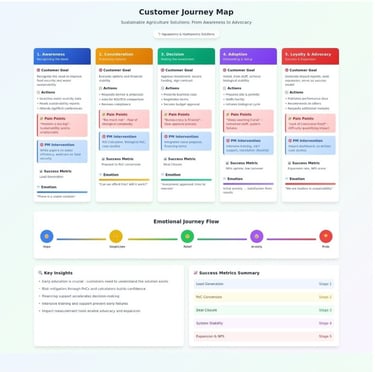
Customer Journey Mapping was used to design the critical alert flow (US 1), optimizing operator response time. User Stories and the Product Backlog were prioritized based on their direct contribution to improving the RES and mitigating R1 risk.
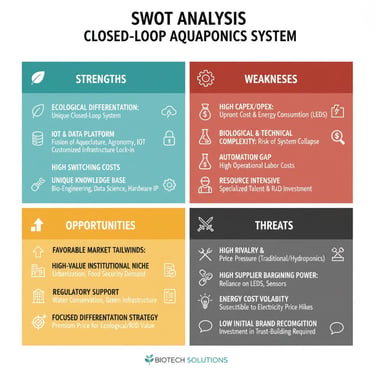
Strategy and risk
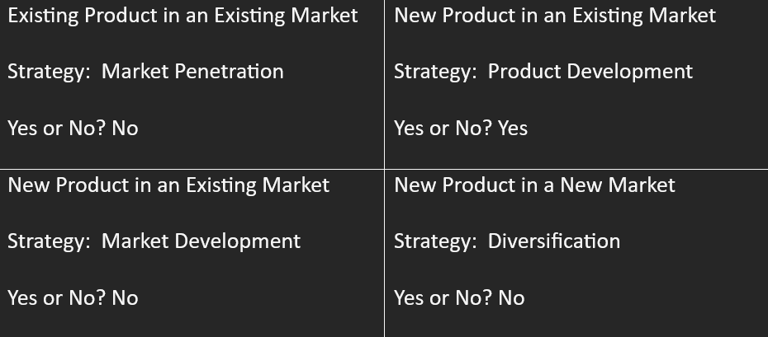
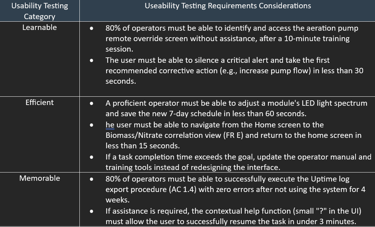
An exhaustive analysis (SWOT, Ansoff Matrix) was performed to focus the growth strategy on B2G Market Penetration and plan the next product generation. The Beta Plan was defined to validate the reliability NFRs before large-scale commercialization.
Tools
Statistical Simulation: Monte Carlo Simulation Risk Modeling. Modeled the probabilistic distribution of the NPV (Net Present Value) using Min/Mode/Max ranges for Yield, Incident Rate (R1), and Energy Consumption (W1).
Advanced Spreadsheets: Creation and calibration of the Business Case and the TCO/ROI Calculator for Sales.
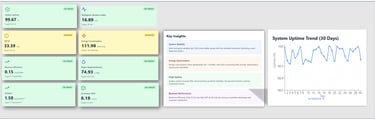
Analytics Tools: Development of the Lean Analytics Dashboard to track key operational metrics: Uptime, MTTR, and Biological Failure Rate (R1) during the Beta Plan.
Financial Validation: The result (e.g., 90% Probability of Positive NPV) was the core argument for the Outcome Summary Dashboard.
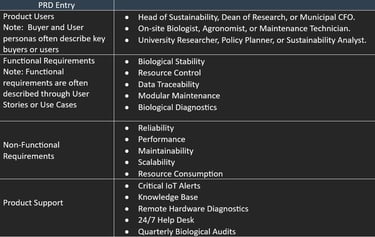
Usability and Adoption: Ensured complex biological management was translated into a simple interface focused on risk mitigation and usability.
Data-Driven Decision Making: Facilitated rapid product iteration and provided the real-world Beta data for the Launch Readiness Assessment.
Actions/Implementations
Risk (R1) Prioritization: The strategic decision was made to delay "nice-to-have" features (e.g., aesthetic customization) to prioritize the DO/pH Alerts in 500ms functionality (NFR 1). This technical choice ensured the validation of MTTR≤30 min in the Beta Plan.
B2G Market Strategy: The Demand Generation Planning was designed based on the need for Proof of Value (PoV). The key action was converting verified results from the Monte Carlo Simulation into Positioning Reports (PoV Reports) for the Sales team.
Lifecycle Management: The EOL Plan was proactively implemented 24 months before the V1.0 retirement. The key action was designing a free Data Migration process for the client's 10 years of historical data, removing the main long-term adoption risk.
Launch Readiness: The Launch Readiness Assessment was completed only after the operational failure rate during the Beta met the Monte Carlo Simulation's pessimistic projection. This ensured the launched product was "bulletproof" against financial risk.

Results/Impact
Net Present Value (NPV): Risk of Negative NPV due to High CapEx
Resource Efficiency Score (RES) (NSM): 0.92 (Confirmed Beta Average).
Biological Risk Rate (R1): Interruption Loss: 5% Yield if MTTR exceeds 30 min.
Customer Expansion: Goal: 60% Conversion of SQL to PoC in 12 months
Strategic Impact
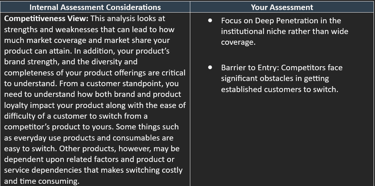
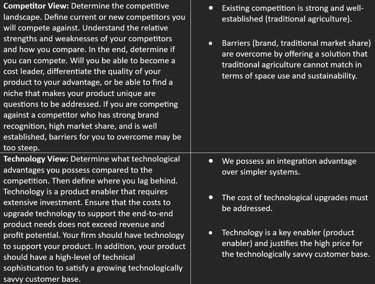
Overcomes the main B2G barrier. Proves that R1-mitigating technology guarantees profitability.
Proves the EcoGrow X-Series sets the new standard for ecological efficiency in the B2G market.
Quantifies the value of the support software (Tier 2), proving that technology investment protects the margin.
Data-driven content (PoV Report) is designed to expedite CapEx decision-making.
Lessons learned
Product Vision: Managing R1 risk was proven more effective through MTTR reduction (rapid response) than through pure prevention. For the EcoGrow Y-Series, investment must shift to Predictive AI (MustHave) to move from mitigation to prevention and further improve the RES.
Stakeholder Management: NPV and the TCO Savings Ratio were the most important CSFs for the Buyer/CFO. Product decisions for the B2G market must be led by financial impact before operational usability.
The early use of the Monte Carlo Simulation served not only as an analysis but also as a prioritization tool for MoSCoW, dismissing features that did not move the financial risk curve.
Key Visuals: The NPV Probability Distribution (Monte Carlo Simulation graph) and the Scenarios Table from the Outcome Summary Dashboard.
Key Diagram: Value Flow Diagram: Shows how low MTTR leads to high Uptime, which results in Yield protection, and ultimately, a Positive NPV.
This proposal not only solves current agricultural inefficiency but establishes a new standard for Institutional Ecological Infrastructure, where biological risk is quantified and financial return is guaranteed with evidence. The EcoGrow X-Series is ready to become the new baseline for sustainability, with the upcoming Y-Series primed for AI-driven prevention
Connect
© 2025. All rights reserved.